Week 1 - Week
11/1/2023 -
Leong Jiahui / 0353469
Bachelor of Design (Honours) in Creative Media
GCD 60504 / INFORMATION DESIGN
Exercises
Instructions
EXERCISE 1: Quantifying Data
WEEK 1 (12/1/2023)
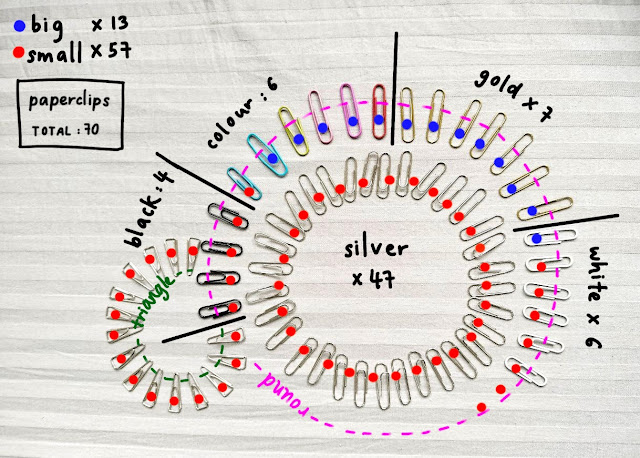
In this exercise, we are required to get our hands on objects we can categorize and quantify like Legos and Buttons. I, unfortunately, have neither of those so I settled for my paperclip pile. They could be more presentable but if they work they work.
First, I categorized them into their respective piles and started counting. They surprisingly amounted to a whole number -70.
 |
| fig 1.1 paperclip counting (15/1/2022) |
 |
| fig 1.2 paperclip arranging (15/1/2022) |
Next, I started scribbling on how I could quantify the data well and this was what I came up with:
 |
| fig 1.3 quantifying data (15/1/2022) |
Final Outcome
 |
| fig 1.4 Exercise 1 Final Outcome (16/1/2023) |
WEEK 2 (19/1/2023)
This week, we are assigned a task to create another infographic, this time utilizing the L.A.T.C.H concept learned in the FLIP classroom. The examples shown were all Pokemon, and unfortunately, I do not play Pokemon. Hence, I decided to make something related to games I'm more familiar with, like Mario or Fire Emblem.
 |
| fig 2.1 infographic concept sketch (20/1/2023) |
 |
| fig 2.2 infographic process in Illustrator (20/1/2023) |
Here's the layout I eventually settled for:
 |
| fig 2.3 Exercise 2 final layout (20/1/2023) |
However, the colours didn't quite sit right with me. Everything looked too vibrant for me, so I decided to experiment with some filters and edited the colours a bit.
Final Outcome
The breakdown:
 |
| fig 2.4.2 Final Outcome according to LATCH (20/1/2023) |


Comments
Post a Comment